Projects
We aim to identify patterns and trends that will enhance our understanding of the topic.
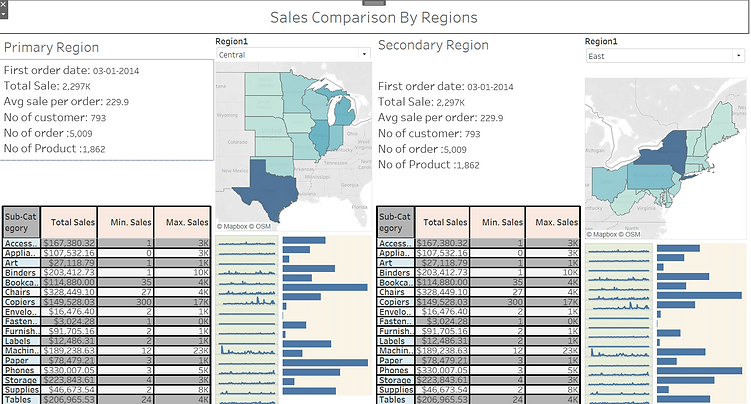
Regional Sale Analysis
Data Visualization
In this project, you will use Tableau to create a dashboard that visualizes the sales performance of two selected regions. This will help the organization understand and compare their performance and suggest necessary improvements. This project will enhance your data visualization, storytelling, and analytics skills, allowing for effective communication of complex information. It will also provide the opportunity to master techniques like data analysis and performance evaluation. This project addresses the need for insightful sales analysis tools, enhancing proficiency in data analytics within the context of sales and performance analysis.
DataVisualisation:EmpoweringBusiness withEffectiveInsights: